How Does the Stock Market Perform When Interest Rates Rise?
3/5/2021 - By Mark Hemby, CFA®
Many believe the recent rise in interest rates is a reflection of investors' expectations for a strong economic recovery, certainly the desired outcome from the COVID-19 pandemic. While this may be a positive sign that we are emerging from the worst of the pandemic, as nearly 14% of Americans have gotten at least one dose of the vaccine, some worry about the collateral damage that may come with rising rates.
Pundits will make the case that rising interest rates lead to higher borrowing costs which can exacerbate debt burdens and make it difficult for businesses to grow (i.e. less disposable income because of higher interest payments). The case can also be made that rising yields reflect investor sentiment of faster growth, which could bring forth a concern of increased inflation.
Unlike bond prices, which are inversely related to yields, stock prices might rise or fall with changes in interest rates. For stocks, it can go either way because a stock’s price depends on both future cash flows to investors and the discount rate they apply to those expected cash flows. When interest rates rise, the discount rate may increase, which in turn could cause the price of the stock to fall. However, it is also possible that when interest rates change, expectations about future cash flows also change. Therefore, depending on the sign and magnitude of any cash flow effect and discount rate effect, theoretically, it is unclear what the net effect of interest rate changes on stock prices should be.
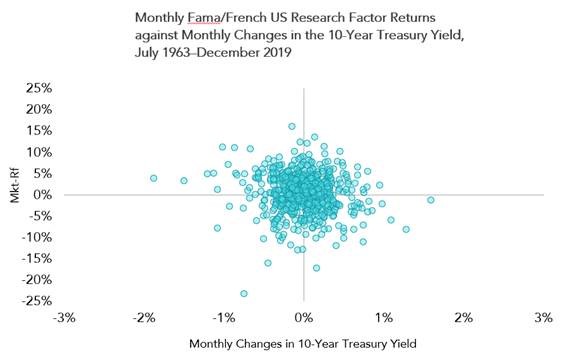
Recent research by Dimensional examines the correlation between monthly US stock returns and changes in interest rates. Exhibit 1 shows that while there is a lot of noise in stock returns, there is no clear pattern between yield changes and subsequent stock returns.
For example, in months when the 10-Year Treasury Yield rose, stock returns were as low as -17% and as high as +15%. In months when rates fell, returns ranged from -23% to +16%. Given there are many other rates besides the 10-Year Treasury, and that interest rates on different points of the yield curve do not always move in lockstep, we also examined the relation on short-term interest rates and found similar results.
A follow-up question many may ask is, “what about the impact of interest rate changes on the size, value, and profitability premiums?” Our research indicates that there is no discernable pattern in the historical data to suggest size, value, and profitability premiums behaved differently in months when interest rates went up vs. when it went down. The patterns—or the lack of clear patterns—were similar when we looked at many different interest rates, including the effective federal funds rate and the 1-, 5-, and 10-year Treasury constant maturity rates.
For investors who have a strong belief in the path interest rates will take in the future, the desire to change their equity investment or exposure to premiums accordingly should be tempered with the notion that even with perfect knowledge of future rate changes, one will not have enough guidance about subsequent returns. Instead, staying invested and avoiding the temptation to make changes based on short-term predictions may increase the likelihood of consistently capturing what the stock market has to offer in any interest rate environment.
Exhibit 1
Past performance is not a guarantee of future results.
Sources: US Treasury data available from FRED, Federal Reserve Bank of St. Louis. Fama/ French Factors shown are provided by Ken French. Factors are not available for direct investment; their performance does not reflect the expenses associated with the management of an actual portfolio. Eugene Fama and Ken French are members of the Board of Directors of the general partner of, and provide consulting services to, Dimensional Fund Advisors LP.
Fama/French Mkt-Rf: The excess return on the market, value-weight return of all CRSP firms incorporated in the US and listed on the NYSE, AMEX, or NSDAQ that have a CRSP share code of 10 or 11 at the beginning of month t, good shares and price data at the beginning of t, and good return data for t minus the one-month Treasury bill rate (from Ibbotson Associates).
At Saltmarsh Financial Advisors, our goal is to help you understand key information and to guide you in making better financial decisions. If you have questions or would like to discuss further, please do not hesitate to contact a member of our team!
About the Author | Mark Hemby, CFA®
Mark is a financial advisor for Saltmarsh Financial Advisors, LLC, an affiliate of Saltmarsh, Cleaveland & Gund. He holds a Chartered Financial Analyst® (CFA) designation and as part of our investment advisory group, he works with clients to develop and implement investment strategies to achieve financial freedom while also ensuring their goals and objectives are aligned.
Related Posts
- Are there State Tax Liabilities for Employers if Employees Work from Home?
- Webinar Materials: Rethinking Financial Reporting - Nonprofit Strategy
- Webinar Materials: New Mortgage Servicing Rules
- Cryptocurrency - It's Time to Acknowledge the Elephant in the Room
- WEBINAR MATERIALS: PRF Reporting Update for Healthcare
- What's New with the Employee Retention Credit: An Overview
- White Paper: Manufacturing Outlook, Lean Thinking to Reduce Costs
- Higher Education in the U.S. - Rising Costs, Enrollment Challenges and the Need for Innovative Solutions
- WEBINAR MATERIALS: Current Update on CARES Act PRF Reporting Instructions & Recent FAQs
- 2021 State & Local Tax Year-End Issues to Consider Now
- The Sky Is Not Falling... Yet
- Cares Act vs American Rescue Plan Act Funding
- GovCon Updates of the Week Part 10
- Covid-19 Implications For Presumptive Laws And Workers' Compensation
- Asset Liability Management Modeling in a COVID-19 World
- Maximizing Value and Minimizing Risk in Your Managed Care Contract Portfolio
- The Excess Liquidity Puzzle
- Finding Flexibility Amid COVID-19: How Nonprofits Can Scale for Success
- White House Unveils Plan to Help American Families Funded by Tax Increases on Wealthy
- Tech Leaders Worldwide Have Optimistic Outlook For 2021
- White Paper: Manufacturing Outlook, Help Wanted
- Employer Tax Credit for Vaccine-Related Sick Leave
- GovCon Updates of the Week Part 5
- IRS Issues Guidance for Claiming Employee Retention Credit in 2021
- Five Metrics Your Construction Company Should Start Tracking Today
- View All Articles


