Cost of Index Reconstitution: Index & Diversification Portfolios
5/15/2025 - By Kaitlin Hendrix, CFA, Asset Allocation Research Director and Vice President, Jerry Liu, PhD, Trading Research Director and Vice President, Trey Roberts, Senior Associate, Research (Dimensional Fund Advisors)
The appeal of low expense ratios and broad diversification has contributed to the growth of index funds. Yet those appealing qualities can come at a cost. Index funds primarily seek to match the performance of an index. This objective may lead to constraints and implementation costs that are not reflected in the funds’ expense ratios.
To help unpack the implications for investors, we can broadly categorize the costs of index investing as those related to:
- Portfolio design, such as ignoring information about differences in expected returns across securities.
- Portfolio management, such as style drift due to infrequent rebalancing and not using short-term information that impacts security returns.
- Trading, such as volume and price pressure around index reconstitution.
Buying High and Selling Low
In recent research, we focus on the third category: costs related to trading. We measure these costs using data from 2014 to 2023 for 10 widely tracked US indices from S&P, Russell, and CRSP and for five international indices covering Australia, Canada, Europe, Japan and the UK.1
Remember that an index fund’s goal is to match the performance of an index, so the fund is heavily constrained in what it trades and when it trades by the index provider. Consistent with many prior studies, our research finds that index additions tend to rise in price ahead of when a fund has to buy them at a reconstitution event and deletions fall in price prior to when an index fund has to sell, while both exhibit reversals following reconstitution.
Exhibit 1 shows the average cumulative excess return of additions and deletions versus those of their respective indices, with excess returns for deletions multiplied by –1 to present addition and deletion results together. The average excess return to additions and deletions for our 15 indices is 3.9% over the 20 days leading up to reconstitution, with a reversal of 4.4% over the 20 days after reconstitution. Results vary across individual indices, but their overall pattern is consistent.

Past performance is no guarantee of future results. Indices are not available for direct investment.
Volume Spike
The creeping 20-day price rise (or fall) and the reversal are accompanied by a spike in trading volume on the day of reconstitution which becomes acute at the market close. Because their objective is to minimise tracking error, index managers not only need to match index holdings before and after reconstitution, they also need to match the price at which the index adds and deletes stocks. This price is set in or near the closing auction.
Trading volume for stocks involved in reconstitution events spikes on reconstitution day on average 23x across the 15 indices examined, and rises as high as 149x for individual indices, compared to the trading volume 20 trading days prior.
In the final few seconds of the day, between the last trade of continuous trading and the closing auction, we see average trading volume spikes across our 15 indices 75x the prior month’s average. For example, stocks added to or deleted from the S&P 500 Index, which has the most tracking assets of the indices we examined, exhibit an increase in trading volume at 4 pm on reconstitution day of around 109x trading volume, compared to the prior month.
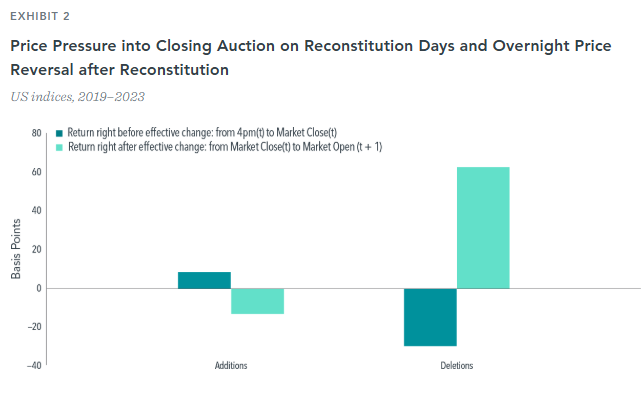
Intraday Price Pressure
Using high-frequency trading data from 2019 to 2023, we zoom in to examine price pressure on reconstitution day for the 10 US indices (see Exhibit 2). We find that prices for additions move up from the end of continuous trading at 4 pm to the closing auction—a span of roughly 10 seconds—and prices for deletions move down (dark blue bars). Like the longer-time-horizon results, there is a reversal for those stocks by market open the morning following reconstitution (light blue bars).
The price of additions on average increases by 9 basis points (bps) compared to the price of nonrebalanced stocks between 4 pm on reconstitution day and market close when being “bought” by the index, and reverses by a relative 13 bps by market open the next day. The opposite is true for deletions: On average, the price for deletions falls relative to nonrebalanced stocks by 30 bps from 4 pm to market close on reconstitution day, just prior to being “sold” from the index, with a reversal of a relative 63 bps by market open the following day. Therefore, by rebalancing just before market close on reconstitution day or by delaying rebalancing to the next trading day, significant price pressure costs could be avoided. We observe similar results for our ex-US indices.
Past performance is no guarantee of future results. Indices are not available for direct investment.
Invisible Costs
Overall, by prioritizing the minimisation of tracking error, index-tracking funds face costs in trading the same securities at the same time on the same day they are added or deleted by indices. The costs borne by this inflexibility are baked into the performance of the indices themselves, not visible from the returns of an index fund against its benchmark. While some have argued that the index reconstitution effect has gone away, we find that spikes in trading volume and price pressure around reconstitution events are still prevalent for 15 major US and international indices in the most recent 10 years. Further, efforts by index providers to mitigate some of the impacts do not come for free. For example, designing asset class indices to share boundaries and have buffers to minimize net buys and sells is likely to lead to a diluted emphasis on premiums and style drift, taking investors off their desired course.
Instead, evidence suggests a better approach would be a daily process that uses information from market prices every day and spreads turnover across all trading days in the year, with flexibility across stocks, quantities, and time. Such an approach can help investors target higher expected returns while also managing risks and costs.
Related Posts
- Cost of Index Reconstitution: Index & Diversification Portfolios
- Three Tips for Riding Out the Ups and Downs: Investment Trends
- Bearish Sentiment: Investment Trends
- Tariffs and Stagflation
- How Extreme was Recent Large Growth Outperformance?
- Tariff Trepidation
- Alphabet Soup of Estate Planning
- It's More Than 'Just a Phase'
- How to Avoid Black Swans
- An Investing Plan for This Year
- Demystifying Personal Injury Settlements: A Guide to Navigating Your Claim
- Reality Check: Capital Market Assumptions vs. Actual Returns
- The Power of Human Ingenuity
- 2024 Year in Review
- Feeling Generous? Secure Your Own Financial Well-Being First!
- Election Years & Their Impact on the Market: A Data-Driven Perspective
- The Unwinding of the Yen "Carry" Trade
- Preventing Identity Theft: Tips to Protect Yourself & Your Family
- Saltmarsh Financial Advisors Recognized as Top Wealth Advisory Firm by Accounting Today
- What is Dollar Cost Averaging?
- Cost of Capital: A Gut Check on High-Flying Stock Returns
- A Closer Look at Today's Inflation (2024 Edition): Not Out of the Woods Yet
- Saltmarsh Hosts 'Building Confidence': A Women-Focused Event Series
- The Power of Compounding in Health and Wealth
- Exciting Returns May Not Be Expected Returns
- View All Articles


