Is a Yield Curve Inversion Bad for Stock Returns?
10/31/2023 - By Dimensional Fund Advisors
Many investors see yield curve inversions—when short-term bond yields exceed long-term yields—as foreboding. Do they signal a stock market downturn? Data from the US and other major economies show yield curve inversions have not historically predicted equity market downturns. As markets incorporate news and events around the world, bond yields change, which causes yield curves to change. Historically, the US Treasury yield curve has generally been upward-sloping; however, during several periods, the curve inverted. What can we learn from these examples?
The US Market
The inversion prior to the 2008 financial crisis is an interesting case study. As shown in Exhibit 1, the US yield curve inverted in December 2005, which was followed by a positive 12-month return for the S&P 500 Index. The yield curve's slope shifted to positive again in June 2007, well prior to the equity market's major downturn from October 2007 through February 2009.
Investors who interpreted the inversion as a sign of an imminent market decline and pulled out of stocks could have missed out on subsequent equity market gains. And if those same investors had bought back into stocks when the yield curve's slope became positive, they would have been exposed to the market downturn that followed.
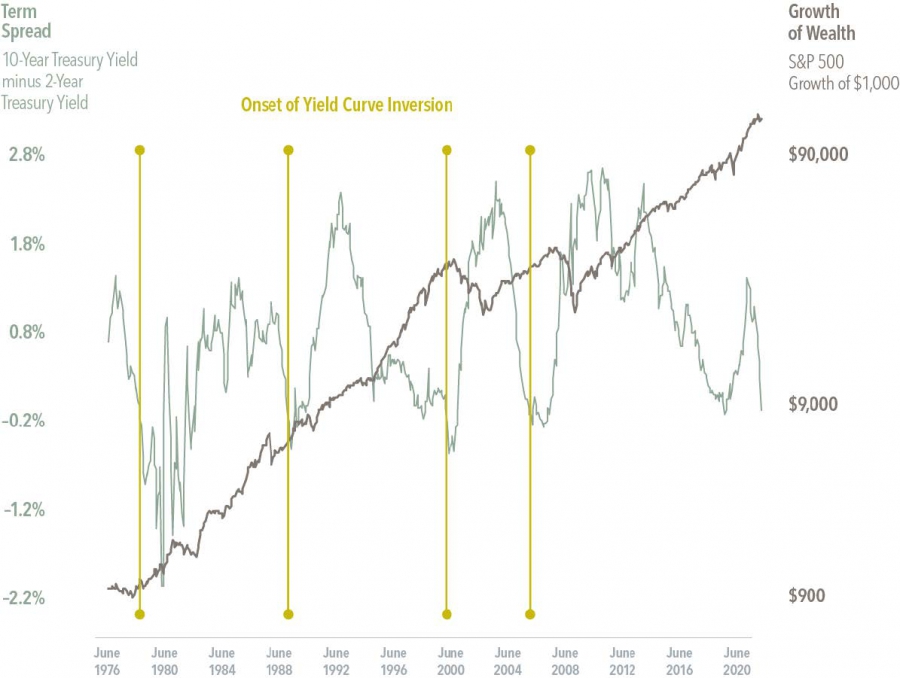
Exhibit 1: Relation between yield curve inversions and US stock market performance. Monthly Data: June 1976-March 2022.
Increasing the Sample
The small number of US yield curve inversions over the past 40 years makes it challenging to draw strong conclusions about the effect on stock market performance. We can, however, expand the sample internationally to include yield curve inversions dating back to 1985 in four additional major developed nations. Exhibit 2 shows the hypothetical growth of wealth of 1,000 units of the country’s local currency invested in the local stock market index the month before yield curve inversions began in five major developed nations, including the US, since 1985.
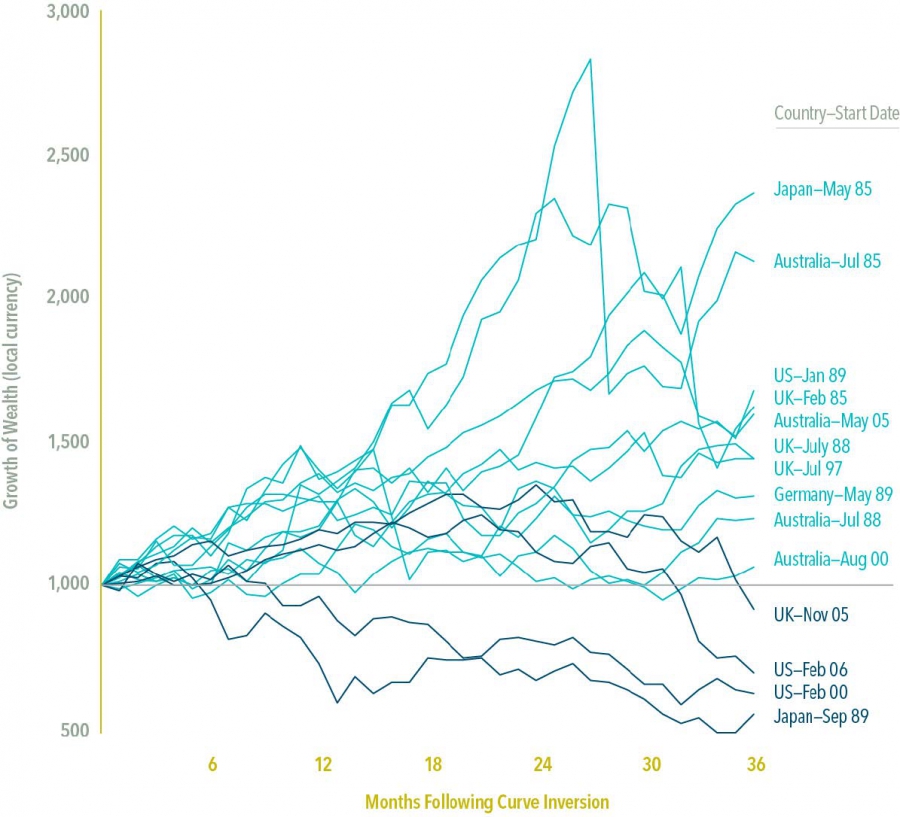
Exhibit 2: Stock market performance in selected developed countries following a yield curve inversion.
In 10 out of 14 cases of inversion, equity investors had positive returns in their home markets after 36 months. This is similar to the historical frequency of positive returns over any three-year span, regardless of the shape of the yield curve (1). These results show that it is difficult to predict the timing and direction of equity market moves following a yield curve inversion. Though the data set is limited, an analysis of yield curve inversions in five major developed countries shows that an inversion may not be a reliable indicator of stock market downturns. So, what can investors do if they are concerned about potential equity weakness? Develop and commit to a long-term plan that is in line with their risk tolerance, look past short-term noise, and focus on investing in a systematic way that will help meet long-term goals.
1. The data showed a 71% chance (10 of 14) of a three-year positive return following a yield curve inversion. To compare, we measured returns three years following every month-end between January 1985 and December 2014 in each of the five markets based on the local currency MSCI indices. The average chance of a three-year positive return in those five markets was 77%.
Related Posts
- Cost of Index Reconstitution: Index & Diversification Portfolios
- Three Tips for Riding Out the Ups and Downs: Investment Trends
- Bearish Sentiment: Investment Trends
- Tariffs and Stagflation
- How Extreme was Recent Large Growth Outperformance?
- Tariff Trepidation
- Alphabet Soup of Estate Planning
- It's More Than 'Just a Phase'
- How to Avoid Black Swans
- An Investing Plan for This Year
- Demystifying Personal Injury Settlements: A Guide to Navigating Your Claim
- Reality Check: Capital Market Assumptions vs. Actual Returns
- The Power of Human Ingenuity
- 2024 Year in Review
- Feeling Generous? Secure Your Own Financial Well-Being First!
- Election Years & Their Impact on the Market: A Data-Driven Perspective
- The Unwinding of the Yen "Carry" Trade
- Preventing Identity Theft: Tips to Protect Yourself & Your Family
- Saltmarsh Financial Advisors Recognized as Top Wealth Advisory Firm by Accounting Today
- What is Dollar Cost Averaging?
- Cost of Capital: A Gut Check on High-Flying Stock Returns
- A Closer Look at Today's Inflation (2024 Edition): Not Out of the Woods Yet
- Saltmarsh Hosts 'Building Confidence': A Women-Focused Event Series
- The Power of Compounding in Health and Wealth
- Exciting Returns May Not Be Expected Returns
- View All Articles