The Excess Liquidity Puzzle
5/24/2021 - By Joshua Jackson, CPA
Liquidity: We’re up to our eyeballs in it.
Over the last 12 months, financial institutions have experienced unprecedented levels of deposit growth driven by consumer and commercial government stimulus (PPP, stimulus checks, unemployment benefits, etc.), as well as elevated household savings rates resulting from stagnant economic activity and consumer flight-to-safety behavior. According to weekly FRB H.8 releases, deposit balances on average have increased roughly 27% across the industry since late February 2020, just prior to the beginning of the pandemic.
Unfortunately, most institutions have not seen a corresponding increase in loan demand, as quality lending opportunities have become scarce in most markets. As a result, many institutions have resorted to holding excess liquidity in overnight accounts as they continue grappling with how best to deploy excess funds in this historically low interest rate environment.
The resulting changes in balance sheet composition across the industry have been striking, as cash balances as a percentage of total assets have nearly doubled since the beginning of the pandemic. In the community banking segment, we have recently seen cash positions in excess of 25% of total assets at some institutions. For context, consider that cash and federal funds sold balances represented roughly 7.50% of total assets for “small domestically chartered commercial banks” in February 2020, based on FRB H.8 reporting.
Many institutions have begun coming to terms with the apparent durability and ‘stickiness’ of surge deposit influx, while others remain less certain. Still, others find themselves paralyzed by the looming threat of interest rate risk associated with deploying excess cash into longer-term instruments in a pending rising rate environment.
Are significant rate hikes on the horizon?
Possibly, though binoculars might be required to see them based on recent Federal Open Market Committee (FOMC) projections.
Figure 1. FOMC participants’ assessments of appropriate monetary policy: Midpoint of target range or target level for the federal funds rate.
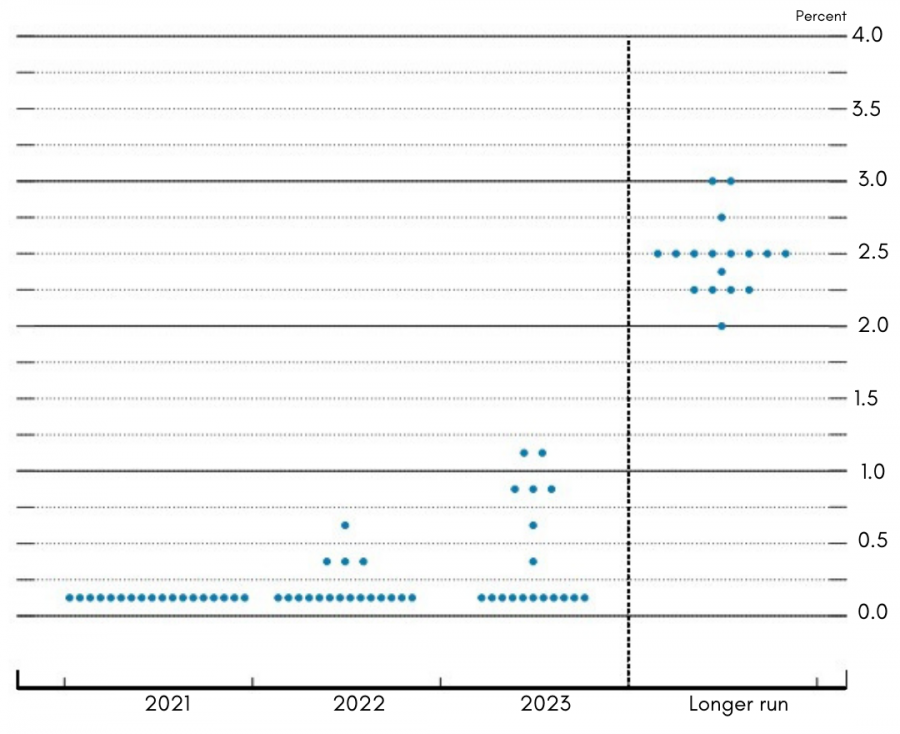
Note: Each shaded circle indicates the value (rounded to the nearest 1/8 percentage point) of an individual participant’s judgment of the midpoint of the appropriate target range for the federal funds rate or the appropriate target level for the federal funds rate at the end of the specified calendar year or over the longer run. One participant did not submit longer-run projections for the federal funds rate. Figure 1 was originally published in the Federal Reserve release, "Summary of Economic Projections". March 17, 2021.
The Fed “dot plot” from March 2021 (above), indicates 11 of the 18 FOMC participants projected the federal funds rate to remain unchanged through the end of 2023. Of course, this is no guarantee that rates will not move sooner. If recent history has taught us anything, however, it’s that we shouldn’t underestimate the patience of the Fed when it comes to raising rates.
What do we do with the excess cash we are seemingly “stuck” with at this point?
There are myriad factors to consider in developing a strategy for handling liquidity abundance in a period of flat or declining loan demand. Based on the particular circumstances of your institution and your market, it could be that continuing to hold cash is the best option for the time being. On the other hand, a tool that might prove useful in the planning process is an analysis of the opportunity costs associated with holding cash.
The following table provides a simple illustration of how the cost of waiting to deploy excess cash might be estimated:
Figure 2.
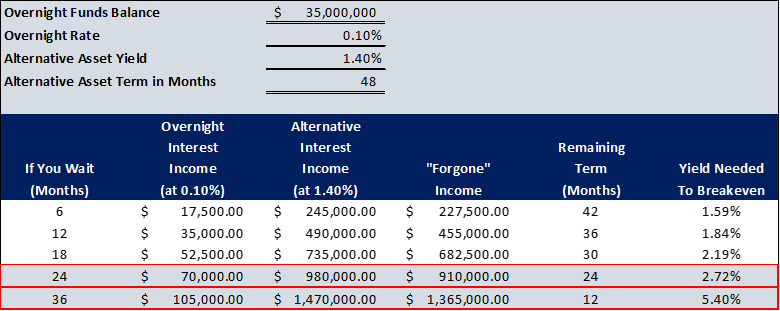
Based on the scenario reflected in the table above, if deployment of excess cash was delayed 36 months from today, you would then need to invest in a one-year asset yielding 5.40% to do as well as you would have if you were to buy the four-year asset today at 1.40%. In other words, you would need to be in something at 5.40% for one year in order to recapture the “forgone” income. Contrast this scenario with the FOMC “dot plot” above, and we can quickly see the potential challenges in achieving a “breakeven” outcome.
At Saltmarsh, we understand the strategic challenges currently facing the financial institutions industry, and our team stands ready to assist you in navigating these uncertain times. If you have any specific needs, or simply need to use us as a sounding board, please do not hesitate to contact a member of our Financial Institutions team.
About the Author | Joshua Jackson, CPA
Josh is a senior manager in the Financial Institution Advisory Group of Saltmarsh, Cleaveland & Gund. He has over 18 years of public accounting and financial services experience, primarily serving financial institutions. Josh has extensive experience in delivering accounting services, external audits, directors’ examinations and agreed-upon procedures, loan and credit quality reviews, internal audits, due diligence projects related to mergers and acquisitions, and other consulting services. Connect with Joshua on LinkedIn.
Related Posts
- Are there State Tax Liabilities for Employers if Employees Work from Home?
- Webinar Materials: Rethinking Financial Reporting - Nonprofit Strategy
- Webinar Materials: New Mortgage Servicing Rules
- Cryptocurrency - It's Time to Acknowledge the Elephant in the Room
- WEBINAR MATERIALS: PRF Reporting Update for Healthcare
- What's New with the Employee Retention Credit: An Overview
- White Paper: Manufacturing Outlook, Lean Thinking to Reduce Costs
- Higher Education in the U.S. - Rising Costs, Enrollment Challenges and the Need for Innovative Solutions
- WEBINAR MATERIALS: Current Update on CARES Act PRF Reporting Instructions & Recent FAQs
- 2021 State & Local Tax Year-End Issues to Consider Now
- The Sky Is Not Falling... Yet
- Cares Act vs American Rescue Plan Act Funding
- GovCon Updates of the Week Part 10
- Covid-19 Implications For Presumptive Laws And Workers' Compensation
- Asset Liability Management Modeling in a COVID-19 World
- Maximizing Value and Minimizing Risk in Your Managed Care Contract Portfolio
- The Excess Liquidity Puzzle
- Finding Flexibility Amid COVID-19: How Nonprofits Can Scale for Success
- White House Unveils Plan to Help American Families Funded by Tax Increases on Wealthy
- Tech Leaders Worldwide Have Optimistic Outlook For 2021
- White Paper: Manufacturing Outlook, Help Wanted
- Employer Tax Credit for Vaccine-Related Sick Leave
- GovCon Updates of the Week Part 5
- IRS Issues Guidance for Claiming Employee Retention Credit in 2021
- Five Metrics Your Construction Company Should Start Tracking Today
- View All Articles