A Closer Look at Today's Inflation (2024 Edition): Not Out of the Woods Yet
4/8/2024 - By Chris Stennett, CFP
It’s April 2024 and it’s been almost 2 years since our last inflation deep dive, when inflation was at decades-long highs. Since then, the Fed aggressively raised rates to combat inflation but has recently paused as inflation slowed. Current inflation data look good in recent context, so many are hopeful the Fed will lower interest rates. However, inflation is rising at concerning rates in a few key categories, which may force the Fed to delay cuts. Let’s review the current state of inflation and areas of concern and discuss what can be done to help reduce its impact.
First, a quick review of inflation. Inflation is the growth rate of prices, described as an annual percentage. In February 2024, the Total Consumer Price Index (CPI) measured at 3.2% for all purchases. Put another way, if you delayed a purchase for one year, you could expect that purchase to cost 3.2% more the next year. It’s not unusual for an economy to see prices go up every year. However, when inflation grows faster than wages, overall purchasing power declines. Over time, this can hurt the economy.
Though today’s inflation of 3.2% is above the Fed’s target of 2% (Source), there has been a decline in the rate at which prices rise. That’s not to say that prices don’t feel high, but rather that the speed of price increases has leveled off. To put this into perspective, the chart below graphs Total CPI over the last 20 years. (Source)
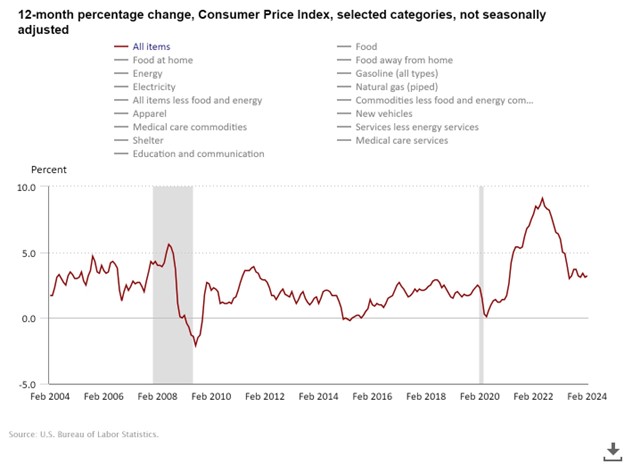
Though overall inflation has declined from 2022 levels, consumers still face many inflation-related concerns. For instance, the graph above shows we’re still above pre-pandemic inflation levels. You can also see that in recent months, inflation appears to be moderating, rather than declining, as it was in prior months.
Food
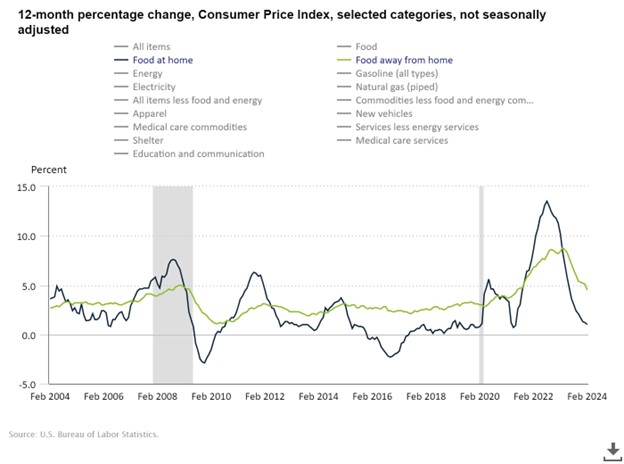
One widely known price increase is in food. Food costs have gone up across the board, whether you’re dining out or at home. Further, we see a pronounced divergence in cost based on where food is consumed. In the chart below you’ll see that “Food at home” inflation (Blue) has returned to pre-pandemic levels with annual growth below 2%. However, “Food away from home” (Green) has had a high growth rate and continues to grow 5% annually. Restaurants were hit hard by pandemic restrictions on dining, and restaurants may continue to struggle if consumers reduce restaurant spending to combat higher inflation.
Shelter
Shelter is another component of CPI that’s been under a lot of pressure since 2020. The chart below shows housing price growth is still well above pre-2007 levels and the Fed’s 2% target.
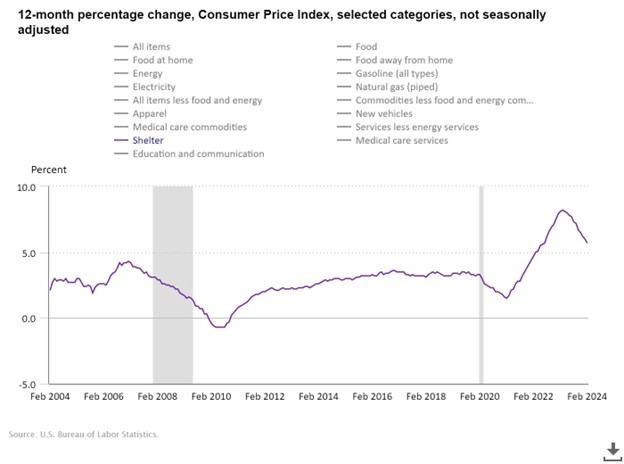
Though shelter costs appear to be on the decline, that figure may also be misleading. It is nearly impossible to get the data needed by the BLS to calculate this figure, so they use this methodology to make a guess. Their calculation to determine shelter inflation uses rent as a proxy for the housing market. However, the rental market and the housing market are not one in the same. While rent prices have declined, home sales have ground to a halt, as higher interest rates force many hopeful homebuyers to wait patiently for home prices to drop to afford the mortgage payments. As home sellers are waiting patiently for interest rates to drop, they also hope to sell their property at peak 2022 values. Should the Fed lower interest rates, home prices could increase further with accelerated demand. This would impact price growth but not necessarily influence the BLS data because of nuances in the calculations.
Services and Wages
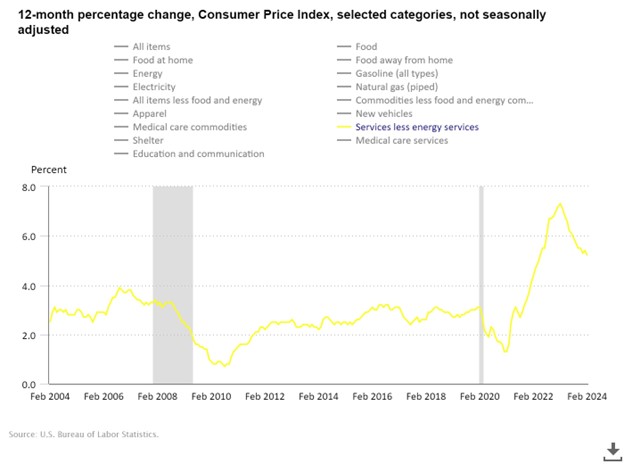
Another area where prices have continued to grow at a concerning level is Services. The chart below shows “Services less energy” (yellow) growing at over 5% per year. Services are increasing by around 5% per year, as businesses have increased prices to manage profitability.
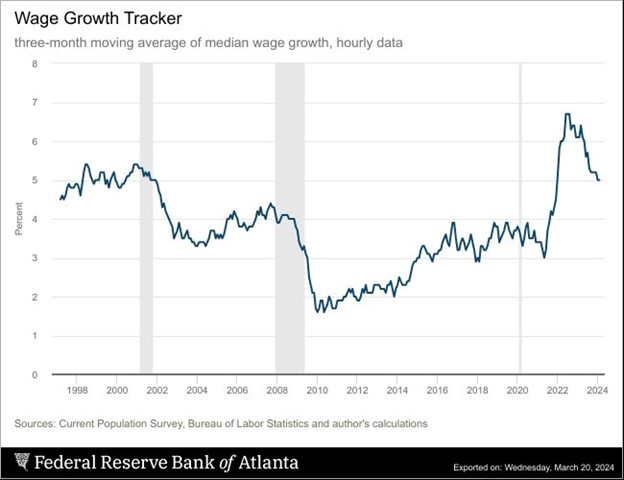
Fortunately, consumers have seen their wages grow to help offset inflation. The chart below shows the average hourly wage growth since 1997. Wage growth (5%) is above the current rate of inflation (3.2%). Today’s annual wage growth rate hasn’t been seen since before 2000. Though this doesn’t make prices at the grocery store any cheaper, it does make paying the bill more tolerable.
Ultimately, inflation has significantly decreased over the last 18 months but has not hit the Fed’s 2% target. The Fed is unlikely to lower interest rates if it still sees inflation as a threat. The recent inflation pulled forward years of price increases into a short period of time. This is why it feels like everything is so expensive. While things are in a better place now than they were 12 months ago, we’ll have to continue to monitor CPI closely. We’re not out of the woods yet.
About the Author | Chris Stennett, CFP®
Chris is a senior financial advisor and Certified Financial Planner® practitioner for Saltmarsh Financial Advisors, LLC, an affiliate of Saltmarsh, Cleaveland & Gund. He serves individuals and organizations as a comprehensive financial planner and coordinator of investment activities. His areas of expertise include investment management, income planning, tax and estate planning and risk management. Chris has over 15 years experience as a wealth manager working with high-net-worth families and privately held business owners across the U.S.
In addition to his role as advisor, Chris is an accomplished presenter known for being able to convey highly technical concepts to every investor. Chris was recently invited to speak at the Tennessee Banker's Association Trust and Wealth Management Conference in Nashville, TN where he presented on the SECURE Act 2.0.
When he's not with his clients, or presenting, Chris spends his time with his wife and 2 daughters traveling and going to the beach.
Related Posts
- Cost of Index Reconstitution: Index & Diversification Portfolios
- Three Tips for Riding Out the Ups and Downs: Investment Trends
- Bearish Sentiment: Investment Trends
- Tariffs and Stagflation
- How Extreme was Recent Large Growth Outperformance?
- Tariff Trepidation
- Alphabet Soup of Estate Planning
- It's More Than 'Just a Phase'
- How to Avoid Black Swans
- An Investing Plan for This Year
- Demystifying Personal Injury Settlements: A Guide to Navigating Your Claim
- Reality Check: Capital Market Assumptions vs. Actual Returns
- The Power of Human Ingenuity
- 2024 Year in Review
- Feeling Generous? Secure Your Own Financial Well-Being First!
- Election Years & Their Impact on the Market: A Data-Driven Perspective
- The Unwinding of the Yen "Carry" Trade
- Preventing Identity Theft: Tips to Protect Yourself & Your Family
- Saltmarsh Financial Advisors Recognized as Top Wealth Advisory Firm by Accounting Today
- What is Dollar Cost Averaging?
- Cost of Capital: A Gut Check on High-Flying Stock Returns
- A Closer Look at Today's Inflation (2024 Edition): Not Out of the Woods Yet
- Saltmarsh Hosts 'Building Confidence': A Women-Focused Event Series
- The Power of Compounding in Health and Wealth
- Exciting Returns May Not Be Expected Returns
- View All Articles


